Investors in the stock market use many different financial metrics and ratios in order to get a better understanding of the valuations and growth potential of the companies trading on the stock market. Some of the most popular ratios include but are not limited to current ratio, debt to equity ratio, earnings per share as well as the price to earnings (P/E) ratio. The latter one is one of the most used ratios in the world of investing as it seen as an interesting and powerful metric to determine the success of a company.
By analyzing the P/E ratio, investors get a better understanding of how much they are paying for every dollar a company earns. Hence, the name price to earnings. However, a higher or lower P/E ratio is very dependent on the industry as well as the growth potential for the respective company. In this article, a closer look is taken at the definition and formula of the P/E ratio, the interpretation of the ratio, how to properly use the P/E ratio in practice and finally a real-world example.
The formula
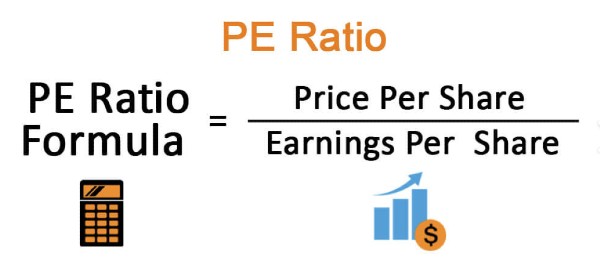
The price-to-earnings (P/E) ratio is calculated by diving the current market price per share by the earnings per share (EPS), where the earnings per share are often calculated or given by the company once they publish their annual report. In other words, the ratio shows how much investors are willing to pay for every $1 of earnings of the company.
For example, a P/E ratio of 20 indicates that investors are willing to pay 20 times the price relative to the earnings of the stock. Furthermore, it is also worth noting that there are two types of P/E ratios. First, the trailing P/E ratio measures the ratio based on the earnings from the past 12 months, this is often used as it reflects and incorporates the historical performance of the company. Alternatively, you can use the forward P/E ratio. Rather than in the past, we estimate the ratio based on the expected future earnings of the company. This is very useful if we expect earnings to increase in the future and as a result, the ratio is likely to go down when the share price remains the same.
The interpretation of the P/E ratio
Now let’s discuss the difference between a high and low P/E ratio. Starting off with a high P/E ratio which is usually a ratio above 25. Higher ratios often imply that investors are expecting more growth in the future and therefore, the earnings of the company are expected to increase as well. This is more of a speculative bet since it is no guarantee the earnings of the company will grow. Alternatively, a high P/E ratio could also be a sign of overvaluation, meaning that investors are currently overpaying for buying shares.
In contrast, a low P/E ratio is usually an indication that a company is either undervalued or because investors have less confidence in the company and its growth prospects. As a result, investors are only willing to buy shares against a “discounted” price.
One important note is that price-to-earnings ratios also differentiate between industries. The tech sector is known for having higher P/E ratios since there are a lot of growth opportunities. In contrast more mature industries like the utility and oil sector tend to have lower average P/E ratios.
How to use the P/E ratio in practice
While the price-to-earnings ratio is very useful for investors to determine the success and affordability of a stock, it is important to look at the bigger picture rather than just a snapshot of the P/E ratio in a certain moment in time.
First, it is recommended to compare the stock’s P/E ratio to the industry average. This gives a better glimpse of how the share is performing compared to other companies within the same industry. When the P/E ratio is much larger compared to the industry average, this might be an indication of overvaluation rather than large growth expectations of investors. Alternatively, this can also be a sign that a company is very hyped and popular among investors since many people are willing to pay a high premium relative to the earnings of the company.
Second, you should always look at previous P/E ratios of the company as this gives you better insights regarding the historical as well as the potential future performance of the company. For example, if we see that the P/E ratio is currently much lower compared to the 1-2 years before this could be a signal that the company is currently undervalued. Alternatively, this could also be a bad sign since the company is losing its competitive edge among newer, more growth-oriented competitors.
A real-world example of the P/E ratio of Nvidia
Nvidia is one of the most popular stocks among investors and grew to one of the largest companies in the world during 2024. So, it comes as no surprise that the P/E ratio of Nvidia is very high. Specifically, the ratio currently sits at 55, meaning that investors are willing to pay 55 times the earnings of Nvidia. While the semiconductor industry is known to have a high industry average (a P/E ratio of 32x), this is almost double the industry average. Hence, investors are expecting a lot of growth for Nvidia in the future. As a result, quarterly earnings for Nvidia and its investors are of major importance as this will give a strong signal if Nvidia is improving its earnings over time. If Nvidia were to miss their earnings, investors might lose confidence and the share price might fall significantly.
Conclusion
The price-to-earnings (P/E) ratio is a financial metric for evaluating the growth potential of a company, offering insights into investor sentiment and market expectations. However, it is important to use this metric in context, considering factors such as industry averages, historical trends, and future earnings projections. While a high P/E ratio may signal optimism for growth, it can also indicate overvaluation, whereas a low P/E may suggest undervaluation or limited investor confidence. As demonstrated by Nvidia’s high P/E ratio, understanding the nuances of this metric allows investors to make informed decisions, balancing growth opportunities with potential risks.


Investors in the stock market use many different financial metrics and ratios in order to get a better understanding of the valuations and growth potential of the companies trading on the stock market. Some of the most popular ratios include but are not limited to current ratio, debt to equity ratio, earnings per share as well as the price to earnings (P/E) ratio. The latter one is one of the most used ratios in the world of investing as it seen as an interesting and powerful metric to determine the success of a company.
By analyzing the P/E ratio, investors get a better understanding of how much they are paying for every dollar a company earns. Hence, the name price to earnings. However, a higher or lower P/E ratio is very dependent on the industry as well as the growth potential for the respective company. In this article, a closer look is taken at the definition and formula of the P/E ratio, the interpretation of the ratio, how to properly use the P/E ratio in practice and finally a real-world example.
The formula
The price-to-earnings (P/E) ratio is calculated by diving the current market price per share by the earnings per share (EPS), where the earnings per share are often calculated or given by the company once they publish their annual report. In other words, the ratio shows how much investors are willing to pay for every $1 of earnings of the company.
For example, a P/E ratio of 20 indicates that investors are willing to pay 20 times the price relative to the earnings of the stock. Furthermore, it is also worth noting that there are two types of P/E ratios. First, the trailing P/E ratio measures the ratio based on the earnings from the past 12 months, this is often used as it reflects and incorporates the historical performance of the company. Alternatively, you can use the forward P/E ratio. Rather than in the past, we estimate the ratio based on the expected future earnings of the company. This is very useful if we expect earnings to increase in the future and as a result, the ratio is likely to go down when the share price remains the same.
The interpretation of the P/E ratio
Now let’s discuss the difference between a high and low P/E ratio. Starting off with a high P/E ratio which is usually a ratio above 25. Higher ratios often imply that investors are expecting more growth in the future and therefore, the earnings of the company are expected to increase as well. This is more of a speculative bet since it is no guarantee the earnings of the company will grow. Alternatively, a high P/E ratio could also be a sign of overvaluation, meaning that investors are currently overpaying for buying shares.
In contrast, a low P/E ratio is usually an indication that a company is either undervalued or because investors have less confidence in the company and its growth prospects. As a result, investors are only willing to buy shares against a “discounted” price.
One important note is that price-to-earnings ratios also differentiate between industries. The tech sector is known for having higher P/E ratios since there are a lot of growth opportunities. In contrast more mature industries like the utility and oil sector tend to have lower average P/E ratios.
How to use the P/E ratio in practice
While the price-to-earnings ratio is very useful for investors to determine the success and affordability of a stock, it is important to look at the bigger picture rather than just a snapshot of the P/E ratio in a certain moment in time.
First, it is recommended to compare the stock’s P/E ratio to the industry average. This gives a better glimpse of how the share is performing compared to other companies within the same industry. When the P/E ratio is much larger compared to the industry average, this might be an indication of overvaluation rather than large growth expectations of investors. Alternatively, this can also be a sign that a company is very hyped and popular among investors since many people are willing to pay a high premium relative to the earnings of the company.
Second, you should always look at previous P/E ratios of the company as this gives you better insights regarding the historical as well as the potential future performance of the company. For example, if we see that the P/E ratio is currently much lower compared to the 1-2 years before this could be a signal that the company is currently undervalued. Alternatively, this could also be a bad sign since the company is losing its competitive edge among newer, more growth-oriented competitors.
A real-world example of the P/E ratio of Nvidia
Nvidia is one of the most popular stocks among investors and grew to one of the largest companies in the world during 2024. So, it comes as no surprise that the P/E ratio of Nvidia is very high. Specifically, the ratio currently sits at 55, meaning that investors are willing to pay 55 times the earnings of Nvidia. While the semiconductor industry is known to have a high industry average (a P/E ratio of 32x), this is almost double the industry average. Hence, investors are expecting a lot of growth for Nvidia in the future. As a result, quarterly earnings for Nvidia and its investors are of major importance as this will give a strong signal if Nvidia is improving its earnings over time. If Nvidia were to miss their earnings, investors might lose confidence and the share price might fall significantly.
Conclusion
The price-to-earnings (P/E) ratio is a financial metric for evaluating the growth potential of a company, offering insights into investor sentiment and market expectations. However, it is important to use this metric in context, considering factors such as industry averages, historical trends, and future earnings projections. While a high P/E ratio may signal optimism for growth, it can also indicate overvaluation, whereas a low P/E may suggest undervaluation or limited investor confidence. As demonstrated by Nvidia’s high P/E ratio, understanding the nuances of this metric allows investors to make informed decisions, balancing growth opportunities with potential risks.