And Where Could the Price Be Heading Next?
These are the questions we’ll be answering today. To determine whether now is the ideal time to buy, we'll be using the Fibonacci retracement tool—a technical analysis method often used to identify potential support levels in stock prices.
Using Fibonacci Retracement to Identify Entry Points
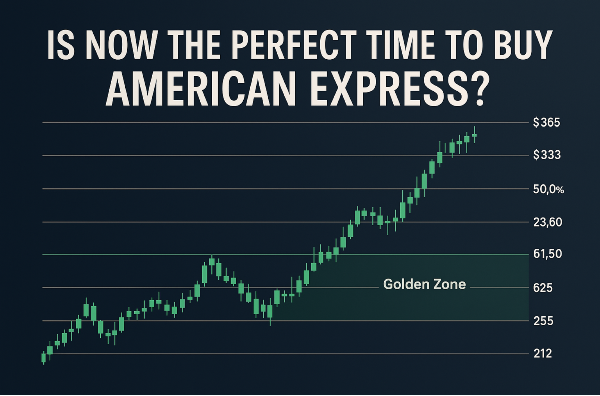
Looking at American Express’s price movement, we see it climbed from a previous low up to a high before experiencing a retracement. By drawing the Fibonacci retracement tool from this low to this high, we get a visual representation of key levels where price action tends to find support.
Typically, when prices retrace in the stock market, they often stabilize at one of these Fibonacci levels. The golden zone, represented by the dark green area, is where prices tend to find the strongest support.
Examining the movement of American Express, we can see that this pattern holds—the price initially found support at a key Fibonacci level before breaking lower and finding stronger support within the golden zone.
Potential Buy Zones
Now, the real question: when is the best time to get in?
Many investors using Fibonacci retracement strategies prefer entering positions in stages—starting at higher Fibonacci levels and averaging down if the price continues retracing.
Here are three areas worth keeping an eye on:
- $255 – The first key support level
- $234 – A deeper retracement level
- $212 – The strongest support level in the golden zone
An entry strategy could involve an initial position at $255, then dollar-cost averaging down if the price moves lower to $234 and $212. This allows investors to reduce their average purchase price and manage risk effectively.
But entering at the right price is only half the equation. Equally important is having a solid exit strategy—which is where the Fibonacci extension tool comes into play.
Using Fibonacci Extension for Exit Strategy
Before we analyze potential exit levels, you might be wondering whether I'm currently holding American Express stock or planning to invest in it.
Most of my portfolio is built around tracking trades made by U.S. politicians. Over the years, I’ve found that investing alongside key politicians has been one of the most profitable strategies in the market. The returns generated from this strategy far exceed those from traditional stock-picking methods.
If you're curious about how I do this and want to learn how you can do it too, I’ve put together a free video on my website explaining the strategy and breaking down its performance over the last three years. You can find the link in the description below.
Now, back to Fibonacci extensions.
By applying the extension tool in a similar manner—starting from previous lows, stretching up to the recent high, and pulling it down to where the retracement ended—we identify key resistance levels.
These levels represent points where investors tend to lock in profits, allowing them to buy back at lower prices if the stock retraces.
Potential Profit-Taking Zones
Based on Fibonacci extensions, here are three areas where investors may consider locking in gains:
- $312 – The first resistance level
- $333 – A stronger resistance area
- $365 – A major profit-taking zone
Selling a portion of shares as the price climbs toward these levels could be a strategic way to manage profits while staying flexible for future pullbacks.
Final Thoughts
As always, the key to successful investing isn't just about getting the timing right—it's about having a plan for both entries and exits.
I’ll be posting update videos as American Express approaches these key levels, so if you'd like to stay informed, consider subscribing to the channel.
If this analysis helped, feel free to drop a like on the video—it really supports the channel!
Also, just a reminder: I'm not a financial advisor, and this is not investment advice. Always conduct your own research and analysis before making any investment decisions.
If you’d like to learn how to profit like a politician, check out the free video linked in the description below.
https://youtu.be/okg-oBRuwHo?si=MswKjR5_yVl_lp0E


And Where Could the Price Be Heading Next?
These are the questions we’ll be answering today. To determine whether now is the ideal time to buy, we'll be using the Fibonacci retracement tool—a technical analysis method often used to identify potential support levels in stock prices.
Using Fibonacci Retracement to Identify Entry Points
Looking at American Express’s price movement, we see it climbed from a previous low up to a high before experiencing a retracement. By drawing the Fibonacci retracement tool from this low to this high, we get a visual representation of key levels where price action tends to find support.
Typically, when prices retrace in the stock market, they often stabilize at one of these Fibonacci levels. The golden zone, represented by the dark green area, is where prices tend to find the strongest support.
Examining the movement of American Express, we can see that this pattern holds—the price initially found support at a key Fibonacci level before breaking lower and finding stronger support within the golden zone.
Potential Buy Zones
Now, the real question: when is the best time to get in?
Many investors using Fibonacci retracement strategies prefer entering positions in stages—starting at higher Fibonacci levels and averaging down if the price continues retracing.
Here are three areas worth keeping an eye on:
An entry strategy could involve an initial position at $255, then dollar-cost averaging down if the price moves lower to $234 and $212. This allows investors to reduce their average purchase price and manage risk effectively.
But entering at the right price is only half the equation. Equally important is having a solid exit strategy—which is where the Fibonacci extension tool comes into play.
Using Fibonacci Extension for Exit Strategy
Before we analyze potential exit levels, you might be wondering whether I'm currently holding American Express stock or planning to invest in it.
Most of my portfolio is built around tracking trades made by U.S. politicians. Over the years, I’ve found that investing alongside key politicians has been one of the most profitable strategies in the market. The returns generated from this strategy far exceed those from traditional stock-picking methods.
If you're curious about how I do this and want to learn how you can do it too, I’ve put together a free video on my website explaining the strategy and breaking down its performance over the last three years. You can find the link in the description below.
Now, back to Fibonacci extensions.
By applying the extension tool in a similar manner—starting from previous lows, stretching up to the recent high, and pulling it down to where the retracement ended—we identify key resistance levels.
These levels represent points where investors tend to lock in profits, allowing them to buy back at lower prices if the stock retraces.
Potential Profit-Taking Zones
Based on Fibonacci extensions, here are three areas where investors may consider locking in gains:
Selling a portion of shares as the price climbs toward these levels could be a strategic way to manage profits while staying flexible for future pullbacks.
Final Thoughts
As always, the key to successful investing isn't just about getting the timing right—it's about having a plan for both entries and exits.
I’ll be posting update videos as American Express approaches these key levels, so if you'd like to stay informed, consider subscribing to the channel.
If this analysis helped, feel free to drop a like on the video—it really supports the channel!
Also, just a reminder: I'm not a financial advisor, and this is not investment advice. Always conduct your own research and analysis before making any investment decisions.
If you’d like to learn how to profit like a politician, check out the free video linked in the description below.
https://youtu.be/okg-oBRuwHo?si=MswKjR5_yVl_lp0E