Last updated on July 28th 2026 by Noah Brody
🏨 RevPAR remains one of the most important metrics for evaluating hotel stocks
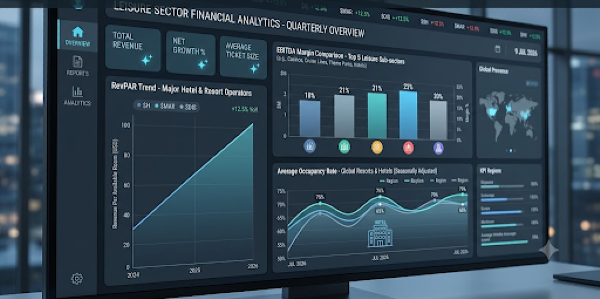
Revenue per Available Room combines occupancy and room pricing into a single measurement that shows how effectively hotels are generating revenue from their available inventory. Strong RevPAR growth often signals pricing power, rising demand, and competitive strength.
🚢 Sector-specific metrics reveal more than traditional financial statements alone
Cruise lines, theme parks, and other leisure businesses rely on specialized measurements such as Net Per Diems, yield, and per-capita guest spending. These metrics help investors understand operational performance beyond standard revenue and earnings figures.
💰 Free cash flow and balance sheet strength separate quality leisure companies from weaker competitors
Leisure businesses often require significant investment in ships, resorts, hotels, and attractions. Companies that convert earnings into free cash flow while maintaining manageable debt levels are better positioned to reward shareholders over the long term.
📊 Valuation metrics must be analyzed alongside business quality and growth potential
Metrics such as enterprise value to EBITDA, leverage ratios, loyalty program strength, and booking trends help investors determine whether a leisure stock's valuation reflects its true competitive position and future growth opportunities.
Key Financial Metrics to Analyze Leisure Stocks
Why Are Financial Metrics Important for Leisure Investors?
Analyzing leisure stocks requires fluency in a set of financial metrics that are either unique to the sector or interpreted differently than in other industries. While universal concepts like revenue growth, operating margin, and return on equity apply across all sectors, the leisure industry has developed its own specialized vocabulary of performance indicators that provide deeper insight into operational health and competitive positioning.
How Does RevPAR Measure Hotel Performance?
Revenue per Available Room, universally abbreviated as RevPAR, is the foundational metric in hotel investing. It is calculated by multiplying the average daily rate of occupied rooms by the occupancy percentage. RevPAR captures both pricing power and demand strength in a single number, making it the most efficient summary of a hotel property's revenue-generating performance. Investors should track RevPAR growth both in absolute terms and relative to competitive set benchmarks, as relative outperformance indicates market share gains.
Which Metrics Matter Most for Cruise Line Investors?
For cruise lines, the equivalent metric is Net Per Diems, which measures net revenue per passenger per day after subtracting onboard and tour revenue from the cost of certain commissions. Yield, which represents revenue per available lower berth day, is also widely used. These metrics allow investors to compare the revenue efficiency of cruise ships regardless of capacity, duration, or pricing tier. Net Cruise Costs per Available Lower Berth Day is the corresponding cost metric that completes the margin picture.
How Do Theme Parks Measure Guest Spending?
Theme park operators use per-capita spending and per-capita revenue as primary performance indicators. Per-capita spending measures the average amount a guest spends during a visit, including admission, food, merchandise, and premium experiences. Rising per-capita spending is a sign of successful upselling strategies and strong consumer willingness to pay. Attendance is tracked separately, as operators must distinguish between visiting more guests and extracting more value from existing guests.
Why Is EBITDA Important for Leisure Companies?
EBITDA, earnings before interest, taxes, depreciation, and amortization, is the most commonly used profitability metric across the leisure sector. Because leisure companies often carry large amounts of depreciating physical assets, net income can be significantly distorted by large non-cash depreciation charges. EBITDA normalizes for these charges, providing a cleaner view of operating cash generation. The EBITDA margin, which expresses EBITDA as a percentage of revenue, allows meaningful cross-company comparisons.
How Should Investors Use Enterprise Value to EBITDA?
Enterprise value to EBITDA is the dominant valuation metric for leisure companies. Unlike the price-to-earnings ratio, EV to EBITDA accounts for differences in capital structure and tax situations, making it particularly useful in an industry where some companies carry substantial debt. A hotel company trading at 15 times EBITDA might appear expensive relative to history but cheap relative to a cruise line trading at 10 times if the hotel company has a far superior business model and growth outlook.
Why Does Free Cash Flow Conversion Matter?
Free cash flow conversion is a critical quality indicator. Free cash flow is calculated as operating cash flow minus capital expenditures. For leisure companies with significant ongoing maintenance capital requirements, the gap between EBITDA and free cash flow can be substantial. High-quality leisure businesses convert a large proportion of their EBITDA into free cash flow, while capital-intensive operators with aging infrastructure may consume much of their EBITDA in maintenance spending before generating meaningful free cash.
How Does Debt Analysis Help Evaluate Leisure Stocks?
Net debt to EBITDA measures financial leverage and is particularly important in the leisure sector where debt levels can be substantial. A ratio below two times is generally considered conservative, two to four times is typical for investment-grade leisure companies, and ratios above five times indicate elevated financial risk. Tracking changes in leverage over time reveals whether management is prioritizing financial discipline or aggressively investing for growth at the expense of balance sheet health.
Why Are Loyalty Programs Valuable Financial Metrics?
Loyalty program metrics are increasingly important for hotel, airline, and casino companies. Member count, active engagement rates, direct booking percentages, and points liability all provide insight into the strategic value of these programs. Loyalty programs that drive high direct booking rates reduce distribution costs and create sustainable competitive advantages. Conversely, over-issued points liabilities can represent a material financial obligation that is sometimes underappreciated by investors.
How Can Booking Data Predict Leisure Stock Performance?
Booking pace and forward revenue visibility are leading indicators of near-term performance. Companies that report strong advance bookings relative to prior year comparisons are signaling revenue momentum before it appears in quarterly results. Monitoring booking windows, average daily rates in forward reservations, and deposit balances provides investors with a meaningful informational advantage in anticipating earnings outcomes.
🚀 Expand Your Edge: Elite Leisure Industry Investment Intelligence
The leisure industry spans travel, entertainment, hospitality, gaming, sports, recreation, and experiential businesses that benefit from rising consumer spending and long-term demographic trends. Our Leisure Industry Investor Intelligence Hub brings together comprehensive research covering industry fundamentals, market-leading companies, macroeconomic drivers, financial analysis, emerging technologies, and future growth opportunities. Explore the curated resources below to build a deeper understanding of one of the market's most dynamic sectors.
🌎 Industry Fundamentals & Market Leaders
🎯 Leisure Industry Sectors & Investment Opportunities
📊 Financial Analysis & Portfolio Strategy
🤖 Technology, AI & Industry Innovation
🌍 Economic Trends & Market Drivers
⚠️ Risk Management & Smart Investing





















Last updated on July 28th 2026 by Noah Brody
🏨 RevPAR remains one of the most important metrics for evaluating hotel stocks
Revenue per Available Room combines occupancy and room pricing into a single measurement that shows how effectively hotels are generating revenue from their available inventory. Strong RevPAR growth often signals pricing power, rising demand, and competitive strength.
🚢 Sector-specific metrics reveal more than traditional financial statements alone
Cruise lines, theme parks, and other leisure businesses rely on specialized measurements such as Net Per Diems, yield, and per-capita guest spending. These metrics help investors understand operational performance beyond standard revenue and earnings figures.
💰 Free cash flow and balance sheet strength separate quality leisure companies from weaker competitors
Leisure businesses often require significant investment in ships, resorts, hotels, and attractions. Companies that convert earnings into free cash flow while maintaining manageable debt levels are better positioned to reward shareholders over the long term.
📊 Valuation metrics must be analyzed alongside business quality and growth potential
Metrics such as enterprise value to EBITDA, leverage ratios, loyalty program strength, and booking trends help investors determine whether a leisure stock's valuation reflects its true competitive position and future growth opportunities.
Key Financial Metrics to Analyze Leisure Stocks
Why Are Financial Metrics Important for Leisure Investors?
Analyzing leisure stocks requires fluency in a set of financial metrics that are either unique to the sector or interpreted differently than in other industries. While universal concepts like revenue growth, operating margin, and return on equity apply across all sectors, the leisure industry has developed its own specialized vocabulary of performance indicators that provide deeper insight into operational health and competitive positioning.
How Does RevPAR Measure Hotel Performance?
Revenue per Available Room, universally abbreviated as RevPAR, is the foundational metric in hotel investing. It is calculated by multiplying the average daily rate of occupied rooms by the occupancy percentage. RevPAR captures both pricing power and demand strength in a single number, making it the most efficient summary of a hotel property's revenue-generating performance. Investors should track RevPAR growth both in absolute terms and relative to competitive set benchmarks, as relative outperformance indicates market share gains.
Which Metrics Matter Most for Cruise Line Investors?
For cruise lines, the equivalent metric is Net Per Diems, which measures net revenue per passenger per day after subtracting onboard and tour revenue from the cost of certain commissions. Yield, which represents revenue per available lower berth day, is also widely used. These metrics allow investors to compare the revenue efficiency of cruise ships regardless of capacity, duration, or pricing tier. Net Cruise Costs per Available Lower Berth Day is the corresponding cost metric that completes the margin picture.
How Do Theme Parks Measure Guest Spending?
Theme park operators use per-capita spending and per-capita revenue as primary performance indicators. Per-capita spending measures the average amount a guest spends during a visit, including admission, food, merchandise, and premium experiences. Rising per-capita spending is a sign of successful upselling strategies and strong consumer willingness to pay. Attendance is tracked separately, as operators must distinguish between visiting more guests and extracting more value from existing guests.
Why Is EBITDA Important for Leisure Companies?
EBITDA, earnings before interest, taxes, depreciation, and amortization, is the most commonly used profitability metric across the leisure sector. Because leisure companies often carry large amounts of depreciating physical assets, net income can be significantly distorted by large non-cash depreciation charges. EBITDA normalizes for these charges, providing a cleaner view of operating cash generation. The EBITDA margin, which expresses EBITDA as a percentage of revenue, allows meaningful cross-company comparisons.
How Should Investors Use Enterprise Value to EBITDA?
Enterprise value to EBITDA is the dominant valuation metric for leisure companies. Unlike the price-to-earnings ratio, EV to EBITDA accounts for differences in capital structure and tax situations, making it particularly useful in an industry where some companies carry substantial debt. A hotel company trading at 15 times EBITDA might appear expensive relative to history but cheap relative to a cruise line trading at 10 times if the hotel company has a far superior business model and growth outlook.
Why Does Free Cash Flow Conversion Matter?
Free cash flow conversion is a critical quality indicator. Free cash flow is calculated as operating cash flow minus capital expenditures. For leisure companies with significant ongoing maintenance capital requirements, the gap between EBITDA and free cash flow can be substantial. High-quality leisure businesses convert a large proportion of their EBITDA into free cash flow, while capital-intensive operators with aging infrastructure may consume much of their EBITDA in maintenance spending before generating meaningful free cash.
How Does Debt Analysis Help Evaluate Leisure Stocks?
Net debt to EBITDA measures financial leverage and is particularly important in the leisure sector where debt levels can be substantial. A ratio below two times is generally considered conservative, two to four times is typical for investment-grade leisure companies, and ratios above five times indicate elevated financial risk. Tracking changes in leverage over time reveals whether management is prioritizing financial discipline or aggressively investing for growth at the expense of balance sheet health.
Why Are Loyalty Programs Valuable Financial Metrics?
Loyalty program metrics are increasingly important for hotel, airline, and casino companies. Member count, active engagement rates, direct booking percentages, and points liability all provide insight into the strategic value of these programs. Loyalty programs that drive high direct booking rates reduce distribution costs and create sustainable competitive advantages. Conversely, over-issued points liabilities can represent a material financial obligation that is sometimes underappreciated by investors.
How Can Booking Data Predict Leisure Stock Performance?
Booking pace and forward revenue visibility are leading indicators of near-term performance. Companies that report strong advance bookings relative to prior year comparisons are signaling revenue momentum before it appears in quarterly results. Monitoring booking windows, average daily rates in forward reservations, and deposit balances provides investors with a meaningful informational advantage in anticipating earnings outcomes.
🚀 Expand Your Edge: Elite Leisure Industry Investment Intelligence
The leisure industry spans travel, entertainment, hospitality, gaming, sports, recreation, and experiential businesses that benefit from rising consumer spending and long-term demographic trends. Our Leisure Industry Investor Intelligence Hub brings together comprehensive research covering industry fundamentals, market-leading companies, macroeconomic drivers, financial analysis, emerging technologies, and future growth opportunities. Explore the curated resources below to build a deeper understanding of one of the market's most dynamic sectors.
🌎 Industry Fundamentals & Market Leaders
🎯 Leisure Industry Sectors & Investment Opportunities
📊 Financial Analysis & Portfolio Strategy
🤖 Technology, AI & Industry Innovation
🌍 Economic Trends & Market Drivers
⚠️ Risk Management & Smart Investing