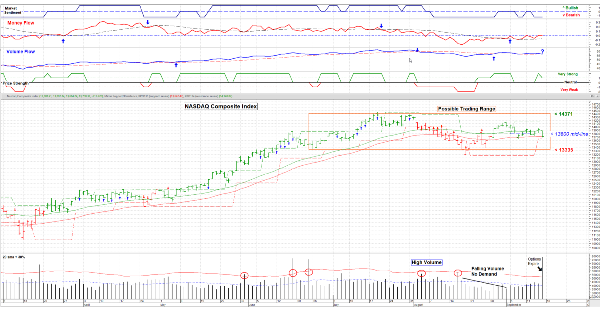
December 15, 2023 – This was the “Santa Claus Rally” and Santa came in the form of Jerome Powel, Chairman of the Federal Reserve System. The mere possibility, even alluding to, interest rate cuts next year by Mr. Powel was all it took. In practice, the economy in the US has been darn good for a while now, especially when compared to the European Union or China, so we were already in a positive / bullish stance.
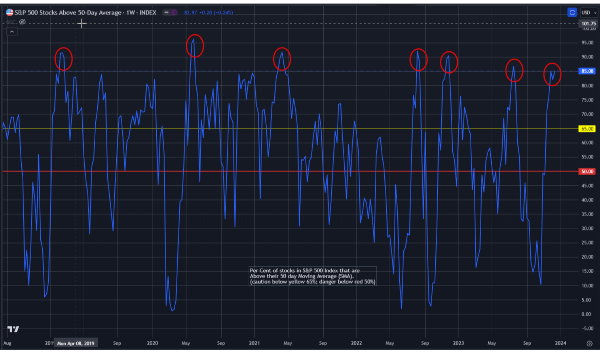
How long can this go on? Well maybe a year but we’re due for a pause in the action so a minor pullback is not unexpected shortly. The chart below shows the percent of stocks in the S&P 500 Index that are above their 50-day moving average. Its intent is to show the breath of a rally.
Note that when it gets above 65% it getting rather frothy and like to fall back to the center. 65% is a rough level of strong market participation, 85% is about tops and 50% is about “average”. Now the market can remain up above 65% for a while, so it doesn’t mean that a major problem is around the corner, just that this market is “getting ahead of itself”.
Volatility
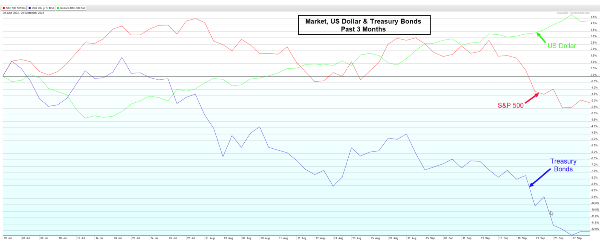
We’re at the end of the year and that’s when stock indexes rebalance. Since the S&P 500 is capital weighted (# shares x price per share) and a select few have had significant gains where others “not so much”, funds, ETF’s etc. will need to buy some and sell some over the last 2 weeks of this year. That could cause unusual moves in select stocks. Just be aware since this time of year liquidity, hence volume, is lower to begin with. Couple that with the increasing popularity of 0DTE options (zero days to expiration) that are for a single day only, you get unusual & quick moves in popular stocks. * *(The reason is option market makers need to offset sold options in the opposite direction to limit their risk.) * Lastly, we see the correlation between Treasury Bond (interest rates), the US Dollar and the stock market. Bonds and the Dollar effect the stock market more than most folks realize.
And so . . . .
I am about 75% invested and will add during a pullback, which I don’t expect to be very severe. 2024 is looking like a positive investing environment unless some geo-political issue raises its ugly head, which is always a possibility. I’m looking at strong sectors but also ones that are just now showing strength, as there will undoubtably be sector rotation ahead.
Until next year, Wishing All (who celebrate it) a Merry Christmas and to All a Happy and Healthy New Year. ……………. Tom ……………







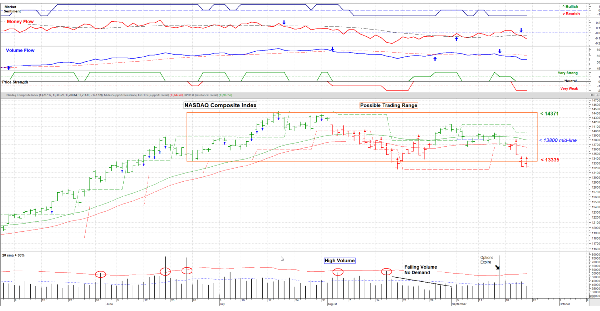
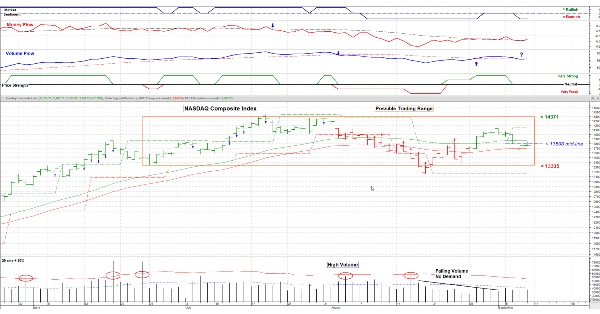


December 15, 2023 – This was the “Santa Claus Rally” and Santa came in the form of Jerome Powel, Chairman of the Federal Reserve System. The mere possibility, even alluding to, interest rate cuts next year by Mr. Powel was all it took. In practice, the economy in the US has been darn good for a while now, especially when compared to the European Union or China, so we were already in a positive / bullish stance.
How long can this go on? Well maybe a year but we’re due for a pause in the action so a minor pullback is not unexpected shortly. The chart below shows the percent of stocks in the S&P 500 Index that are above their 50-day moving average. Its intent is to show the breath of a rally.
Note that when it gets above 65% it getting rather frothy and like to fall back to the center. 65% is a rough level of strong market participation, 85% is about tops and 50% is about “average”. Now the market can remain up above 65% for a while, so it doesn’t mean that a major problem is around the corner, just that this market is “getting ahead of itself”.
Volatility We’re at the end of the year and that’s when stock indexes rebalance. Since the S&P 500 is capital weighted (# shares x price per share) and a select few have had significant gains where others “not so much”, funds, ETF’s etc. will need to buy some and sell some over the last 2 weeks of this year. That could cause unusual moves in select stocks. Just be aware since this time of year liquidity, hence volume, is lower to begin with. Couple that with the increasing popularity of 0DTE options (zero days to expiration) that are for a single day only, you get unusual & quick moves in popular stocks. * *(The reason is option market makers need to offset sold options in the opposite direction to limit their risk.) * Lastly, we see the correlation between Treasury Bond (interest rates), the US Dollar and the stock market. Bonds and the Dollar effect the stock market more than most folks realize. And so . . . . I am about 75% invested and will add during a pullback, which I don’t expect to be very severe. 2024 is looking like a positive investing environment unless some geo-political issue raises its ugly head, which is always a possibility. I’m looking at strong sectors but also ones that are just now showing strength, as there will undoubtably be sector rotation ahead. Until next year, Wishing All (who celebrate it) a Merry Christmas and to All a Happy and Healthy New Year. ……………. Tom ……………